Reaching SDG goals on the local level: the power of a digital self-monitoring tool
A self-monitoring tool turned out to be a major motivator for local communities to progress towards SDG 6: water and sanitation for all. Simavi's Karmath Subedi explains.

Meet Karmath Subedi, the Monitoring, Evaluation and Learning Officer working for Simavi in Nepal. For the past 4 years, Karmath has taken the lead in ensuring that the WASH SDG sub-programme in Nepal achieves its targets, which are linked to Sustainable Development Goal 6, water and sanitation for all. At the programmatic and national level, progress is regularly measured. For example, by using the indicators from the JMP ladder. These are designed to benchmark and monitor drinking water, sanitation, and hygiene levels across countries worldwide. However, until recently, locally led recurring data collection was not being practiced.
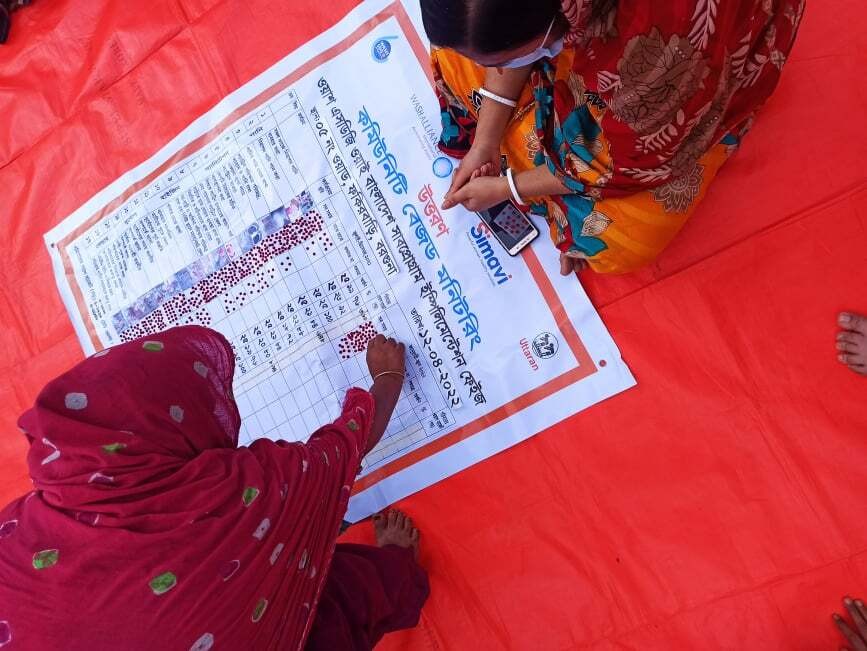
In 2022, during a cross-learning visit to Bangladesh, Karmath witnessed the community practicing a self-monitoring approach to ensure hygiene practices were followed. Inspired by this, he brought the approach back to Nepal and designed a digital self-monitoring tool to track household progress on the JMP ladder.

Self-assessment by 1,746 households
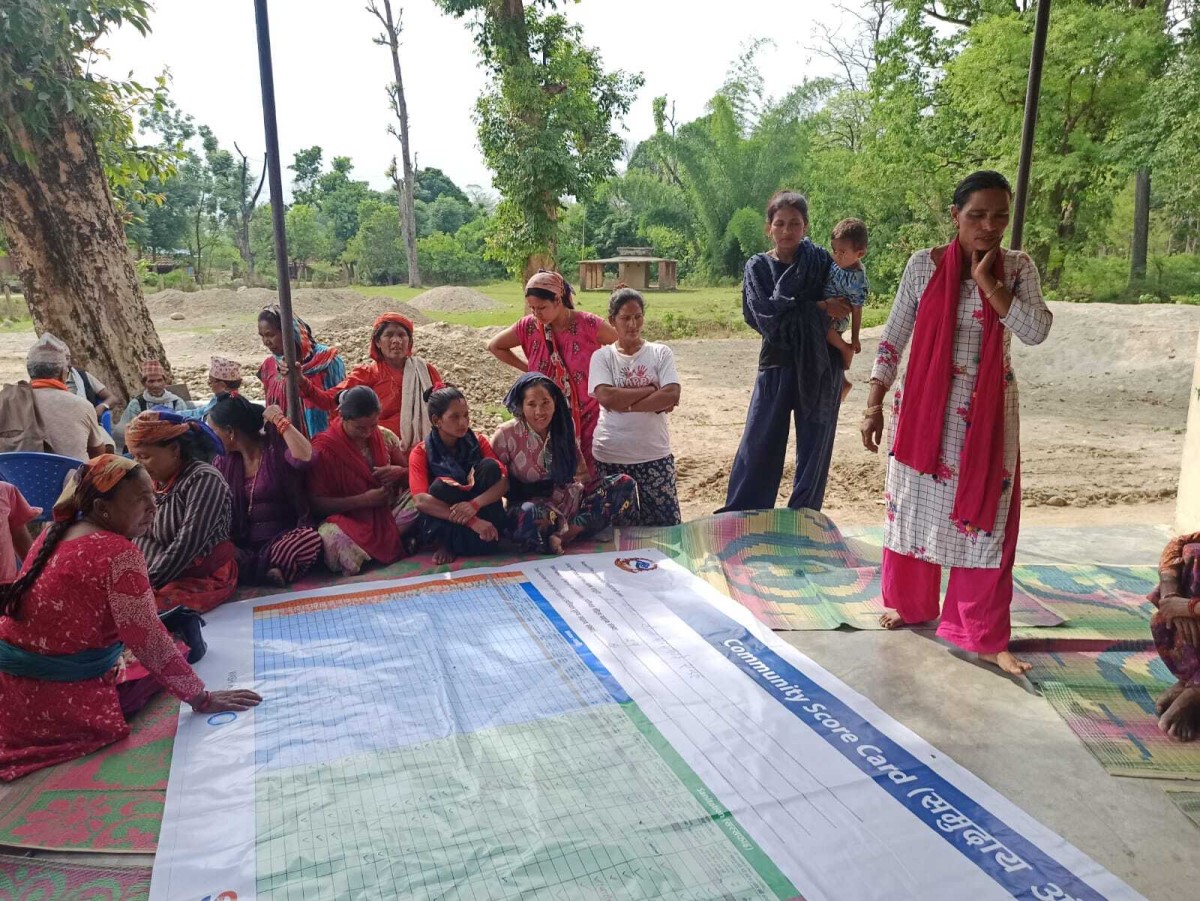
Later that year, WASH Alliance partners Simavi and Sahakarmi Samaj conducted the first pilot of the community-based self-monitoring tool. A total of 87 community groups, comprising 1,746 households assessed themselves based on global indicators, leading to increased awareness and empowerment. The assessments were done during regular community group meetings, on flex sheets which allowed active participation by attendees.
Simultaneously, community educators entered the data through a mobile app and based on their response, each household received a final score on a scale of 4 along with their JMP ladder status. This created a sense of competition among community members. For example, after the self-assessment 47 households conducted water quality tests because it was a requirement for achieving the "safely managed" status. Other than scoring better in the assessment, households became aware of the quality of their drinking water and had an opportunity to adopt household water treatment options if required.

The impact of comparing scores
Witnessing community members compare their scores and use the tool as a motivator was already an indicator of the tool’s effectiveness. A second round of self-assessment, 6 months later, confirmed this. The percentage of households consuming safely managed drinking water had risen from 13% to 31%. Additionally, the percentage of households consuming water from either unimproved sources or surface water decreased from 3% to 0% and the percentage of households practicing safely managed sanitation services rose from 63% to 84%. Open defecation decreased from 2% to 0.16%.
For the WASH Alliance this is only the beginning. In the future they aim to collaborate with the local government to incorporate these data into their website for monitoring activities. Other challenges are to train community members on the usage of digital data collection tools, and encouraging service providers to utilize this periodic data for planned and accountable service delivery. More learning, adaptation, and replication is around the corner.

